The History of the 60/40 Portfolio
The 60/40 portfolio is one of the most well-known and widely used investment strategies. It traditionally allocates 60% of an investor’s portfolio to stocks and 40% to bonds. The idea behind this portfolio is to strike a balance between higher-risk, higher-return assets (stocks) and lower-risk, more stable assets (bonds). Here’s an overview of its history and evolution:Origins (1950s–1970s)
The roots of the 60/40 portfolio can be traced back to the Modern Portfolio Theory (MPT), developed by economist Harry Markowitz in the early 1950s. MPT introduced the concept of creating a diversified portfolio to maximize returns for a given level of risk. The 60/40 portfolio emerged as a simple, practical application of this theory, offering a balance between growth (from stocks) and income/stability (from bonds).At this time, bonds were seen as a safe-haven asset, and equities provided significant upside potential. In the post-World War II economic boom, especially in the U.S., this approach became appealing to long-term investors, including pension funds and individual savers.
Growth and Popularity (1980s–2000s)
The 1980s saw the 60/40 portfolio rise in popularity as inflation was brought under control, and bonds once again became attractive. Paul Volcker’s leadership at the Federal Reserve in the late 1970s and early 1980s led to a steep reduction in inflation, causing bond yields to stabilize and rise, which made bonds more attractive to investors.
During the 1980s and 1990s, the U.S. stock market experienced tremendous growth, driven by the dot-com boom and other economic factors. In this environment, the 60/40 portfolio delivered solid returns, with the bond allocation providing a buffer against market volatility.
In the 1990s, William Sharpe introduced the Sharpe ratio, which helped validate the balanced nature of portfolios like the 60/40 in terms of risk-adjusted performance.
The 2000s and the Financial Crisis
The early 2000s saw two major crises: the bursting of the dot-com bubble (2000–2002) and the global financial crisis of 2007–2008. The 60/40 portfolio was tested during these periods. Bonds, particularly U.S. Treasuries, outperformed equities during the downturns, helping to cushion the losses from the stock market. This reaffirmed the importance of the 40% bond allocation, as it demonstrated its ability to provide downside protection.
However, critics began to question the efficacy of the 60/40 portfolio, especially after the financial crisis, given the low-interest rate environment and lower future bond returns.
Recent Evolution (2010s–2018)
In the 2010s, the stock market, particularly in the U.S., experienced a long bull run, with relatively low volatility. Bonds, however, entered a period of historically low yields due to central banks’ quantitative easing (QE) policies in response to the financial crisis.
As a result, many investors and financial professionals began to question whether the 60/40 portfolio was still relevant. With bond yields at or near zero, the traditional buffer against stock market volatility seemed to be eroding. In response, some investors began experimenting with more complex strategies, including higher allocations to equities, alternative investments, or the use of real assets like gold or real estate.
Post-COVID Era (2022–Present)
The post-COVID era has further complicated the outlook for the 60/40 portfolio. In response to the pandemic, governments around the world, including the U.S., introduced massive fiscal stimulus packages and central banks enacted aggressive monetary policies to stabilize their economies. While these actions supported economic recovery, they also fueled inflationary pressures, leading to a sharp rise in interest rates in the following years.
This environment of rising inflation and higher interest rates poses challenges for both stocks and bonds. Higher inflation can erode the real returns of bonds, and rising interest rates can lead to falling bond prices, reducing the traditional diversification benefit of the 40% bond allocation. Additionally, stock markets have become more volatile in the wake of the pandemic due to global supply chain issues, labor shortages, and geopolitical tensions.
As a result, some investors have reconsidered the classic 60/40 allocation and started exploring alternatives, such as increasing allocations to equities, incorporating inflation-protected securities, or diversifying into real assets like commodities and real estate to hedge against inflation.
Despite these challenges, the 60/40 portfolio remains a solid foundation for investors with moderate risk tolerance, though its future performance may depend on how inflation, interest rates, and economic conditions evolve in the post-COVID world.
There has also been increasing concern about the sustainability of the bond market, especially given the rising levels of U.S. government debt. High levels of debt could put upward pressure on interest rates or lead to inflationary pressures, which may reduce bond values over time.
Despite these challenges, the 60/40 portfolio has remained a staple for many long-term investors, particularly those with moderate risk tolerance. Its simplicity, ease of implementation, and historical performance continue to make it a popular choice.
60/40 Portfolio Backtest Results
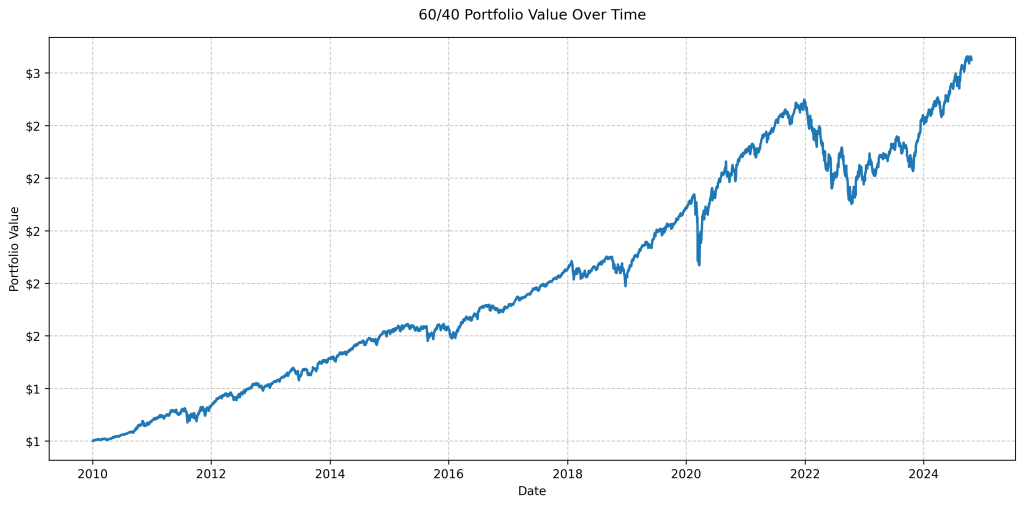
Our backtest of a 60/40 portfolio (60% VOO, 40% BND) from 2010-01-04 to 2024-10-21 yielded the following results:
Overall Performance
- Compound Annual Growth Rate (CAGR): 7.24%
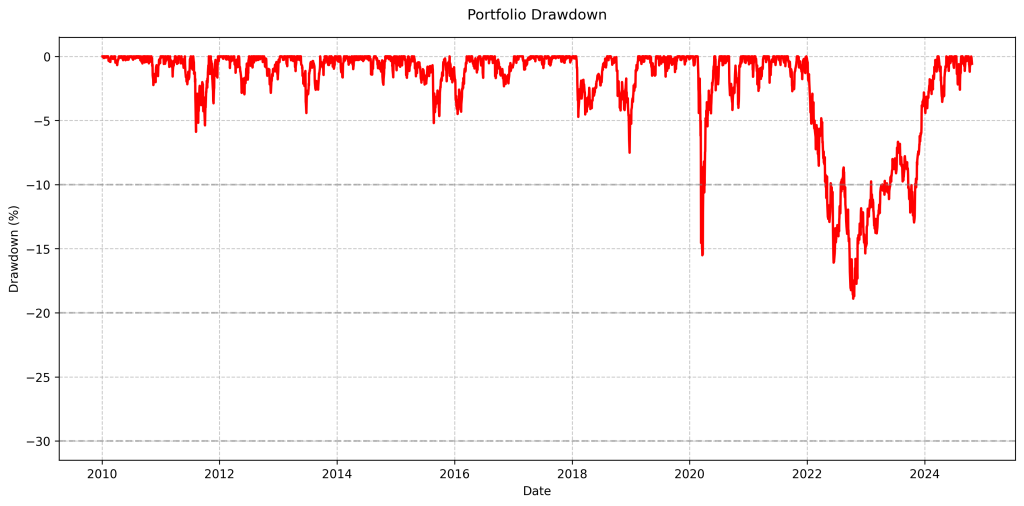
- Maximum Drawdown (MDD): -18.91%
- Sharpe Ratio: 0.72

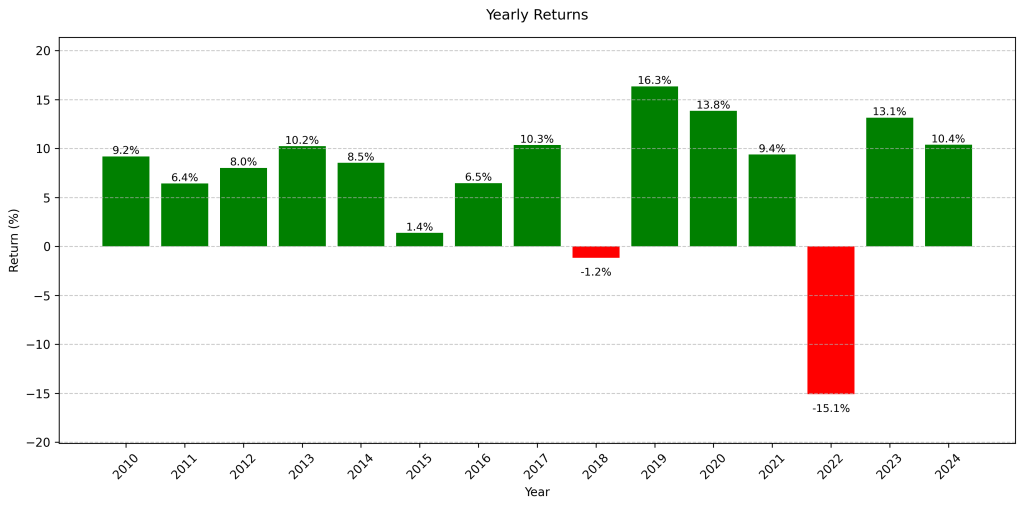
Yearly Performance
- 2010: Return: 9.56%, Sharpe Ratio: 2.15, MDD: -2.24%
- 2011: Return: 6.30%, Sharpe Ratio: 0.55, MDD: -5.89%
- 2012: Return: 8.23%, Sharpe Ratio: 1.32, MDD: -2.96%
- 2013: Return: 10.63%, Sharpe Ratio: 1.63, MDD: -4.42%
- 2014: Return: 8.81%, Sharpe Ratio: 1.57, MDD: -2.21%
- 2015: Return: 1.21%, Sharpe Ratio: -0.10, MDD: -5.20%
- 2016: Return: 6.53%, Sharpe Ratio: 0.85, MDD: -2.74%
- 2017: Return: 10.86%, Sharpe Ratio: 3.07, MDD: -1.04%
- 2018: Return: -1.39%, Sharpe Ratio: -0.48, MDD: -7.52%
- 2019: Return: 17.62%, Sharpe Ratio: 3.10, MDD: -1.58%
- 2020: Return: 13.39%, Sharpe Ratio: 0.74, MDD: -15.52%
- 2021: Return: 9.65%, Sharpe Ratio: 1.30, MDD: -2.72%
- 2022: Return: -14.64%, Sharpe Ratio: -1.42, MDD: -18.54%
- 2023: Return: 13.75%, Sharpe Ratio: 1.54, MDD: -6.74%
- 2024: Return: 10.76%, Sharpe Ratio: 1.72, MDD: -3.55%


This backtest demonstrates the long-term performance of a classic 60/40 allocation strategy, balancing growth potential with risk mitigation. The CAGR of 7.24% shows solid long-term growth, while the maximum drawdown of -18.91% illustrates the strategy’s resilience during market downturns.
The overall Sharpe ratio of 0.72 indicates a favorable risk-adjusted return. However, as we can see from the yearly breakdown, performance can vary significantly from year to year.
Remember that past performance doesn’t guarantee future results. Always consider your personal financial situation and risk tolerance when making investment decisions.